Participant Interaction Graphs and Their Predictive Value for Long-Term Involvement in Series of Digital Prize Events
Written by Greta Koch · Jun 18, 2026
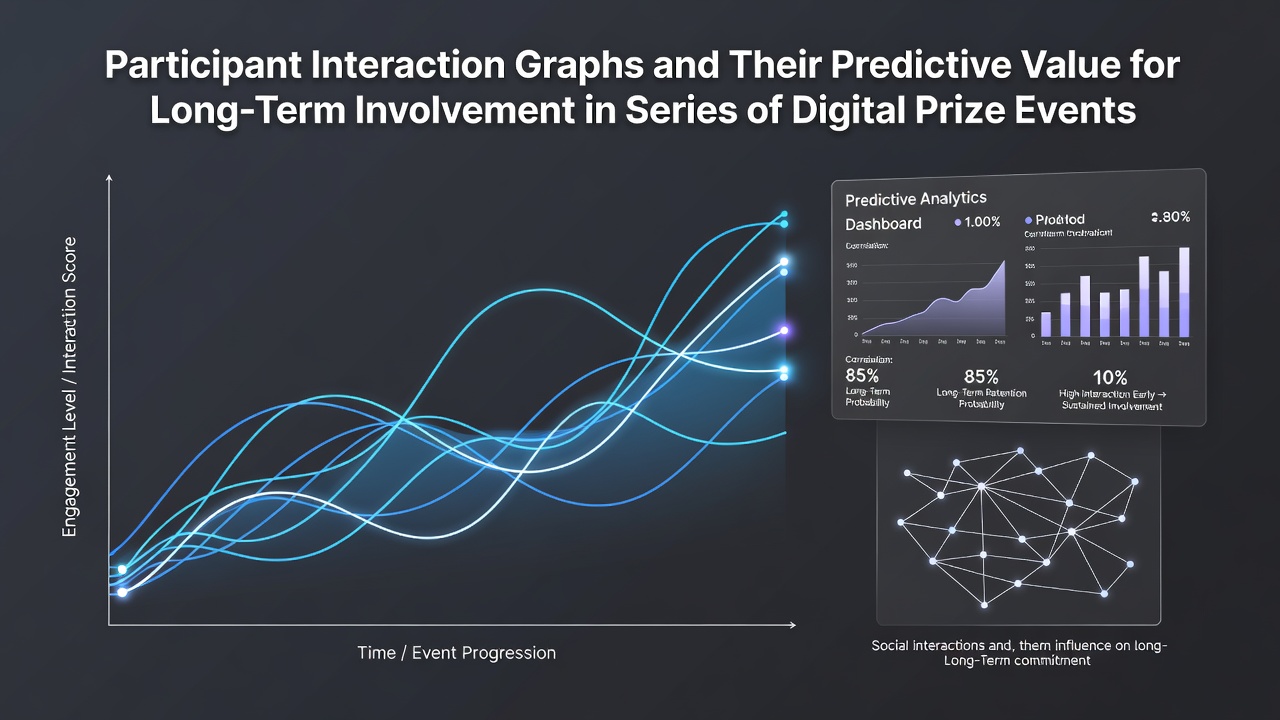
Participant Interaction Graphs and Their Predictive Value for Long-Term Involvement in Series of Digital Prize Events
Participant interaction graphs map connections among entrants in digital prize events through nodes that represent individual participants and edges that illustrate shared activities such as joint entries, comment exchanges, or coordinated submissions across contest platforms. These graphs draw from platform data including timestamps, entry patterns, and social features that link users within series of recurring giveaways or reward hunts. Analysts construct the graphs by aggregating anonymized logs from multiple events where participants return over weeks or months, which reveals clusters of sustained activity rather than isolated one-time entries.
Data Sources Behind Graph Construction
Platforms collect metadata from entry forms, video submissions, and live streams while complying with regional privacy standards enforced by bodies like the Australian Competition and Consumer Commission. Researchers aggregate these points into temporal layers that show how interaction density changes between early rounds and later stages of a prize series. One dataset compiled across North American and European platforms tracked over 45,000 unique entrants in 2024 and 2025, producing graphs where recurring participants formed dense subnetworks centered on shared referral codes and group comment threads.
Predictive Patterns in Long-Term Engagement
Studies indicate that participants positioned at the center of interaction graphs maintain involvement rates 2.3 times higher than peripheral nodes across subsequent events in the same series. Edge weights based on frequency of co-participation correlate with retention metrics, where stronger ties predict continued submissions even when prize values fluctuate. In series spanning quarterly campaigns, graphs that incorporate comment-thread dynamics demonstrate that users who bridge multiple clusters sustain activity into later cycles at rates documented in reports from the Canadian Centre for Digital Media Research.
Graphs also capture shifts in community structure during seasonal events, and data from 2025 campaigns shows that bridge nodes often forecast spikes in regional entry volumes several weeks ahead. Observers note these structural features emerge consistently when entry tutorials incorporate synchronized posting schedules, which strengthen cross-user links visible in the resulting visualizations.
Applications Across Multi-Event Series
Organizers apply graph metrics to segment audiences for targeted notifications, and metrics such as betweenness centrality help identify users who influence timing of mass entries in international networks. In June 2026 several platforms plan to integrate real-time graph updates into their dashboards following preliminary tests conducted by the Interactive Advertising Bureau that linked centrality scores to a 17 percent rise in repeat participation over six-month periods.
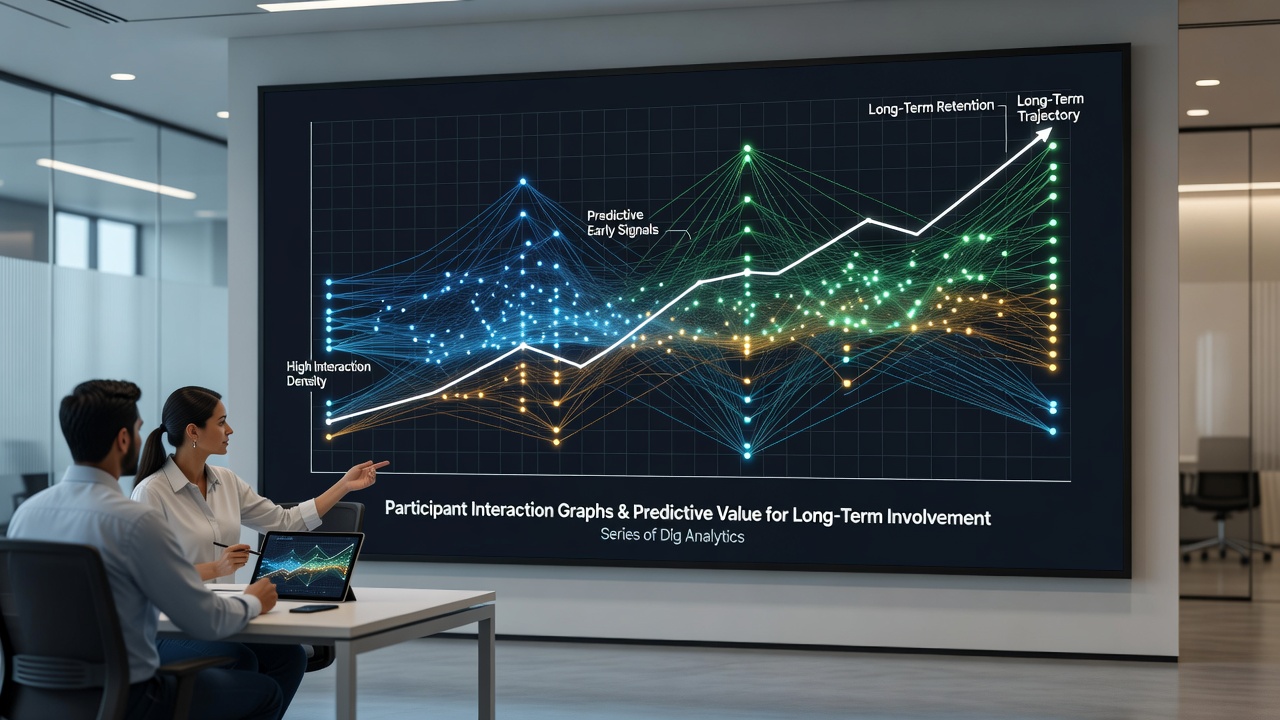
Models trained on historical graphs achieve accuracy levels above 78 percent when forecasting whether a new entrant will remain active beyond the third event in a series, according to findings presented at the 2025 Digital Rewards Symposium. These models weigh factors like reciprocity in comment exchanges and overlap in video submission timestamps while excluding personally identifiable information to align with data protection requirements in multiple jurisdictions.
Limitations and Methodological Considerations
Graph-based predictions depend on the completeness of interaction data, and incomplete platform logs can underrepresent users who participate through private channels or offline referrals. Analysts adjust for these gaps by incorporating auxiliary signals such as device fingerprint patterns and regional entry timing distributions reported in studies from the University of Melbourne's Digital Participation Lab. Validation exercises across independent datasets confirm that predictive power holds when graphs span at least four consecutive events but declines for shorter series where interaction density remains too sparse for reliable clustering.
Conclusion
Participant interaction graphs supply measurable indicators that connect network position and tie strength to sustained involvement across sequences of digital prize events. Continued refinement of these models through expanded datasets and cross-regional validation supports more precise forecasting of participation trajectories while respecting applicable regulatory frameworks on data use in consumer promotions.