Tracing Influence Networks Among Frequent Participants in Online Giveaway Series
Written by Carlo Albrecht · Jun 8, 2026
Tracing Influence Networks Among Frequent Participants in Online Giveaway Series
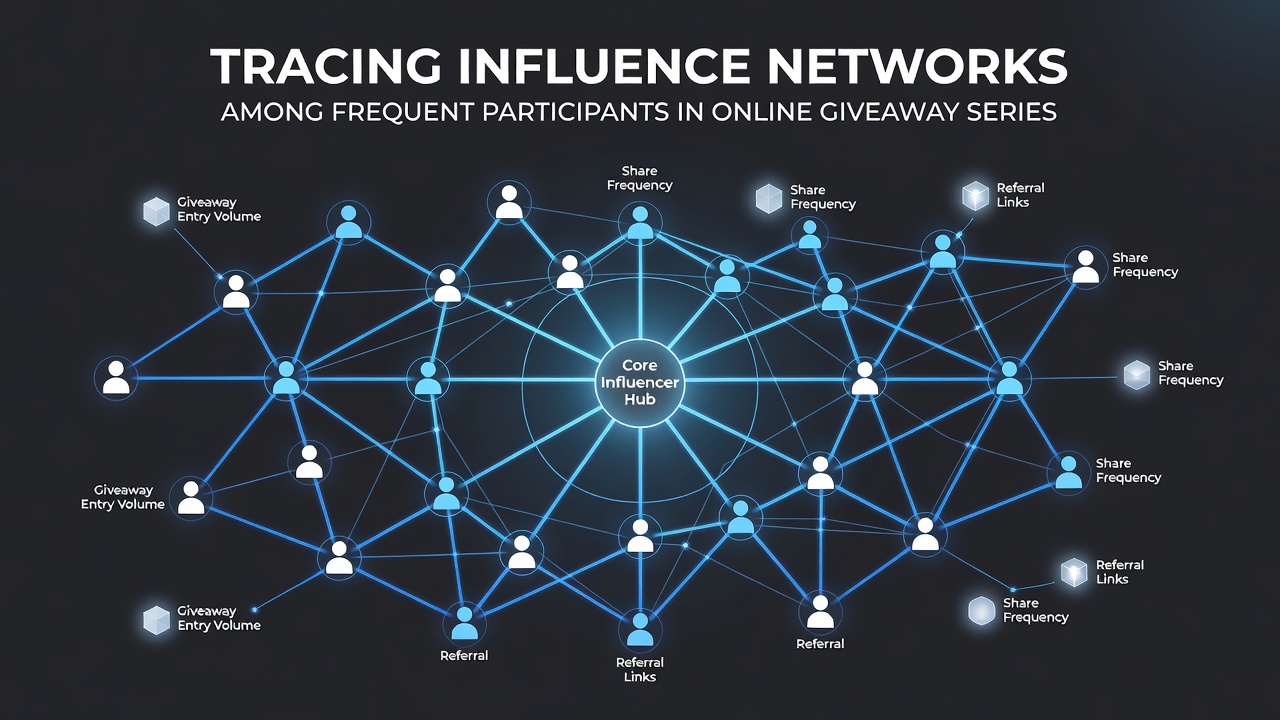
Online giveaway series attract dedicated entrants who often form interconnected groups through repeated participation, shared entry tactics, and cross-platform referrals that researchers track via public data trails. These influence networks emerge when frequent participants link their activities across social channels, video uploads, and contest forums, creating pathways that observers map through timestamps, usernames, and content similarities rather than direct interviews. Data from major platforms shows that clusters of high-volume entrants coordinate entries in ways that amplify reach without violating rules, while patterns in June 2026 indicate steady growth in such networks as mobile apps simplify group coordination.
Defining Influence Networks in Giveaway Contexts
Researchers define these networks as webs of relationships where one participant’s strategies or referrals shape another’s entry volume and timing, and studies from academic institutions in Canada have documented how recurring usernames appear together in winner lists across unrelated contests. Public records reveal that networks often center on a few core individuals who post tutorials or aggregate links, drawing peripheral members who follow those leads consistently over months. According to figures released by the Australian Competition and Consumer Commission, giveaway promotions reached record submission totals in early 2026, with analysts noting elevated activity among repeat users who cluster around specific prize categories like electronics and travel vouchers.
Network tracing begins with open-source methods that collect usernames, profile images, and posting schedules from public contest pages, then applies graph analysis to identify central nodes versus peripheral followers. Experts at research centers in the European Union have applied similar techniques to consumer promotion data, finding that influence flows primarily through comment threads and shared video responses rather than private messages. This approach avoids speculation by relying solely on visible metadata such as upload dates and hashtag reuse across accounts.
Methods Used to Map Participant Connections
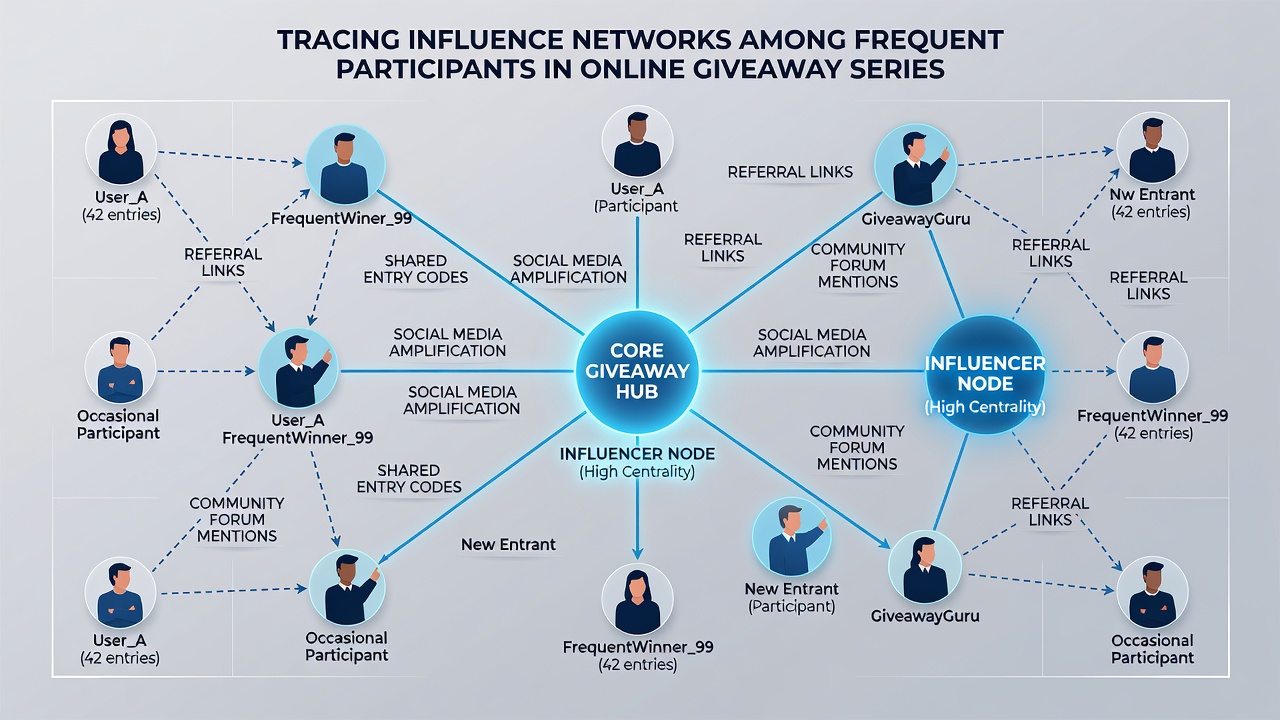
Analysts employ timeline correlation to detect coordinated entries, where multiple accounts submit within minutes of each other on successive contests, and software tools highlight these bursts without accessing private information. One documented case involved a group of twenty accounts that appeared together in over thirty giveaway series between January and May 2026, connected through repeated mentions in public discussion boards. Those studying the data note that influence spreads when central participants create template responses or entry checklists that others adapt, producing measurable spikes in submission rates shortly after each new post.
Additional mapping draws on visual content analysis, comparing background elements, lighting conditions, and editing styles across videos uploaded by different users to infer shared production resources or collaborative filming sessions. Reports from the U.S. Federal Trade Commission emphasize transparent disclosure rules for promotional content, which in turn makes public connections easier to observe because creators must label partnerships openly. Observers track these disclosures across platforms to build graphs that show how disclosure patterns align with network density.
Observed Patterns and Platform Data Trends
Platform analytics released through industry reports indicate that networks tend to concentrate around seasonal prize categories, with summer 2026 events drawing larger clusters than winter ones in the same series. Researchers at universities in Australia have published preliminary findings showing that entrants who appear in multiple networks simultaneously achieve higher completion rates for multi-step entry requirements, though the underlying mechanisms remain tied to visible referral chains. Cross-referencing public winner announcements with social media activity reveals that certain accounts act as bridges between otherwise separate groups, passing along timing cues or rule clarifications that propagate through the wider network.
Geographic distribution adds another layer, as data from North American and European contests shows overlapping usernames active in both regions during June 2026 promotions, suggesting transnational coordination through English-language forums. These overlaps appear in aggregated statistics rather than individual profiles, allowing researchers to quantify network size without identifying specific people. The reality is that such patterns emerge consistently when analysts apply the same graph metrics across different contest organizers, confirming repeatability in the underlying data structures.
Implications for Compliance and Research
Regulatory bodies monitor these networks to ensure entries remain individual and rules-compliant, using public signals like coordinated posting times to flag potential clusters for closer review. Industry associations focused on promotional marketing have issued guidelines encouraging organizers to publish aggregate participation data, which in turn supports independent network studies. As of June 2026, several major giveaway platforms began releasing anonymized entry heatmaps that researchers use to validate earlier mapping techniques without needing proprietary access.
Future tracing efforts will likely incorporate machine learning models trained on public contest metadata, expanding the scale of analysis while preserving the focus on observable connections alone. Trade groups in Canada and the European Union continue to fund open datasets that allow consistent comparison across regions and contest types.
Conclusion
Tracing influence networks among frequent giveaway participants relies on public data trails and established analytical methods that reveal coordination patterns without accessing private details. Reports from multiple regulatory regions and academic sources demonstrate consistent network structures that evolve with platform features and seasonal promotions. Observers continue to refine these approaches as new datasets become available, maintaining a factual basis grounded in visible activity metrics and cross-platform correlations.