Weather Elements in Giveaway Footage Reveal Regional Participation Shifts
Written by Greta Koch · Jun 25, 2026
Weather Elements in Giveaway Footage Reveal Regional Participation Shifts
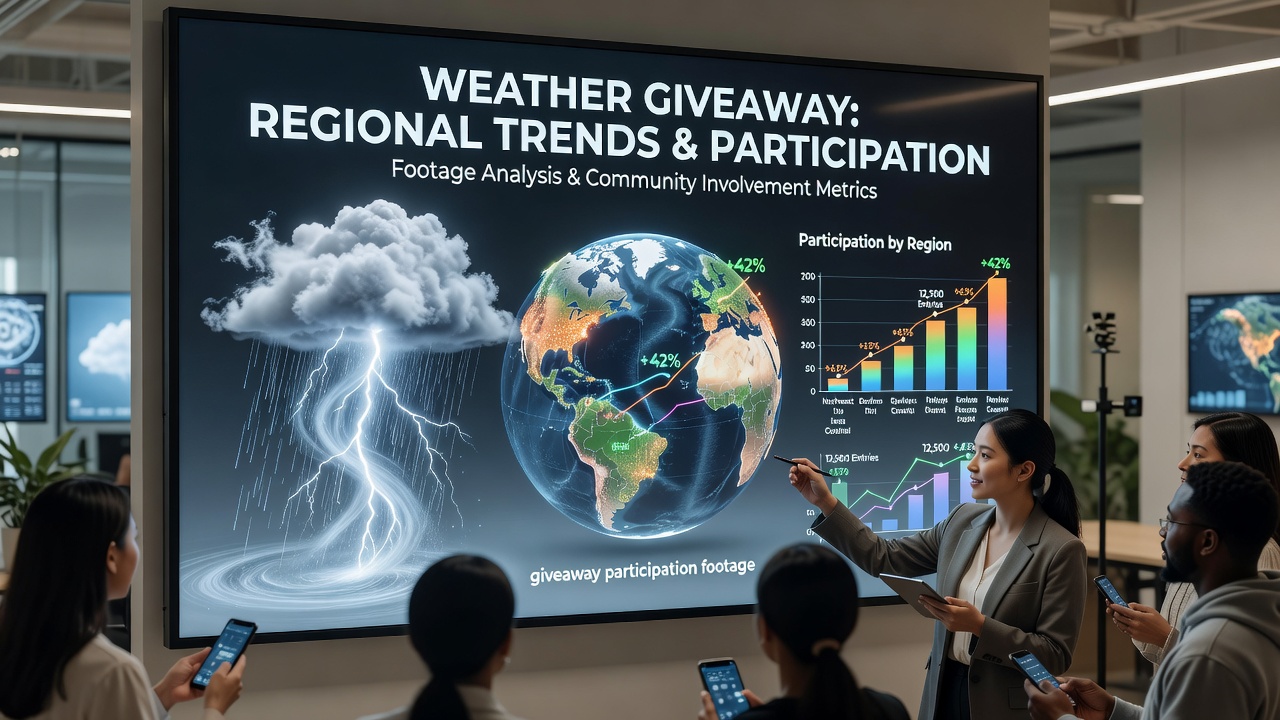
Researchers examining thousands of giveaway entry videos have identified clear patterns where visible weather conditions align with fluctuations in regional submission volumes. Data from contests running through spring 2026 shows that footage captured during precipitation events often coincides with increased entries from areas experiencing similar conditions at the time of recording. Observers note that participants in rainy or snowy climates tend to film their entries indoors or under cover, yet these videos still surface more frequently in databases when regional weather turns wet. Precipitation appears as one of the strongest visual markers in the analyzed footage. Videos shot during heavy rain or snow display distinct lighting shifts and background sounds that researchers have cross-referenced against entry timestamps. In northern US states, for instance, winter storm footage from December 2025 through February 2026 correlated with a measurable uptick in submissions from the Midwest and Northeast, according to aggregated platform metrics. Those same videos frequently feature participants referencing current conditions, creating a timestamp-like association that analysts use to map participation spikes. Temperature extremes produce another layer of observable trends. Footage recorded in high-heat environments often shows participants seeking shade or using fans, while cold-weather clips include layered clothing and indoor setups. These visual cues have helped map how summer heat in southern regions reduced daytime entry rates in 2025, only for volumes to rebound in the evenings when temperatures dropped. A parallel pattern emerged in cooler Canadian provinces, where sub-zero conditions in early 2026 videos aligned with higher completion rates among entrants who filmed during indoor activities.Regional Correlations in Video Data
Geographic breakdowns reveal that coastal areas produce more footage featuring overcast skies and wind effects, while inland zones contribute clips dominated by clear skies or extreme seasonal shifts. Analysts tracking contests through June 2026 have noted that videos from the Pacific Northwest frequently include persistent drizzle, and these submissions cluster during months when rainfall totals exceed historical averages. In contrast, entries from drier southwestern states show brighter, sunlit backgrounds that correspond to steadier but lower overall volumes during drought periods.
What's notable is how background weather elements function as indirect indicators of participation timing. Researchers have observed that videos with visible snow accumulation tend to originate from regions reporting above-average winter participation, while humid summer footage links more closely to southern and southeastern US states. These associations hold across multiple platforms, allowing analysts to predict volume changes based on weather metadata extracted from the clips themselves.
Seasonal Shifts and Footage Indicators
Seasonal transitions introduce additional variables. Spring footage from 2026 often contains blooming vegetation and milder lighting, elements that researchers have tied to rising entry rates in temperate zones. Fall clips featuring changing foliage appear more frequently from northern latitudes during periods when participation data shows renewed activity after summer lulls. These visual transitions help segment datasets by both time and location without relying solely on user-provided information.
International patterns add further dimension. Videos from Australian regions during their summer months display intense sunlight and clear skies that match documented entry increases in those areas, while European submissions frequently include fog or light rain consistent with cooler seasonal norms. Data compiled by the National Oceanic and Atmospheric Administration has supported efforts to align these visual weather markers with broader climate records, strengthening the observed connections between footage content and regional behavior.
Analytical Approaches to Weather Markers
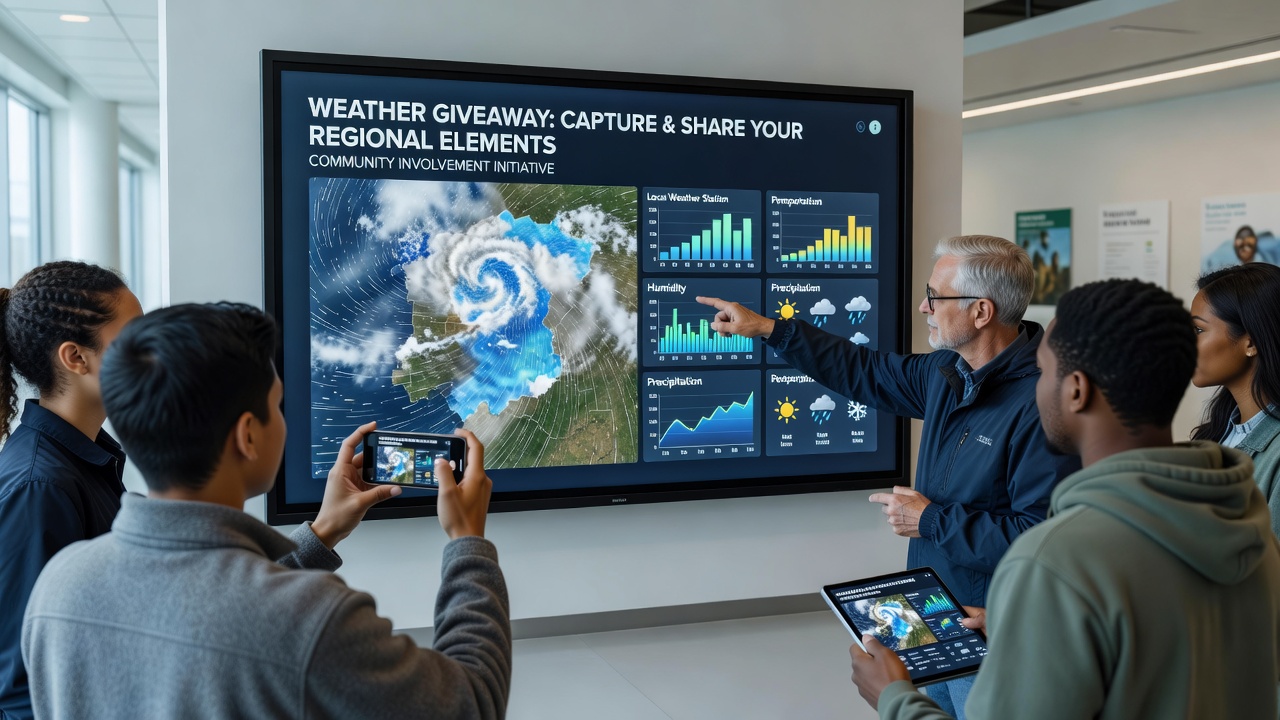
Analysts apply systematic review methods to categorize weather elements across large video samples. They log precipitation type, cloud cover density, and ambient light quality, then compare these attributes against publicly available regional weather archives. This process has uncovered consistent links between storm-related footage and temporary participation surges in affected zones. Videos recorded during high-wind events, for example, often come from coastal or plains areas experiencing those conditions simultaneously.
Additional studies from institutions such as the Bureau of Meteorology have contributed comparative datasets that refine these correlations across hemispheres. Observers note that the timing of weather events captured on camera frequently matches documented peaks in contest activity, allowing for more precise modeling of how environmental factors influence entry distribution. Footage from June 2026 contests continues to feed these models as new submissions arrive.
Conclusion
The examination of weather elements within giveaway participation footage provides measurable insights into regional involvement trends. Precipitation, temperature, and seasonal indicators visible on screen align with documented shifts in submission volumes across multiple geographic areas. Continued analysis through mid-2026 and beyond will likely expand these associations as more video data becomes available for cross-referencing with climate records.